Moving through Byzantine Shivta
Introduction
It is often difficult, or impossible, to study the everyday practices which were performed in an ancient town. Indeed, the traditional archaeological approach is often insufficient. Using as a case study the Byzantine settlement of Shivta, in the Negev desert (Fig. 1-2), the aim of this research is to investigate which is the potential of Urban Network Analysis (UNA) to investigate the everyday life in Byzantine towns.
Methodology
Two types of network analysis were used. The first was the ‘reach analysis’ which allows to calculate the total of inhabitants which are likely to use each of the three churches present in the site of Shivta due to network proprieties (Fig.3-4).
The second was the ‘betweenness analysis’ which allows to calculate the passersby potential going to the three churches of Shivta from each dwelling house (Fig.5).
Results
The ‘reach analysis’ indicates a value of 879 frequenters for the southern church, 857 for the central church and only 514 for the northern church. The ‘betweenness analysis’ shows a high value of passersby in the northern area of the site. These results highlight differences in the network between the northern and the southern part of the settlement which was not expected. Indeed, due to the results of the ‘reach analysis’, was assumed a different outcome.
Conclusions
Urban Network Analysis (UNA) was able to provide a new insight for the study of the site. The wide array of methodological tools available in this approach allows testing different theoretical models, which are untestable wit traditional archaeological methods. The next step will be to analyse different targets, such as the administrative buildings of the site, which will be compared with others data from the site.
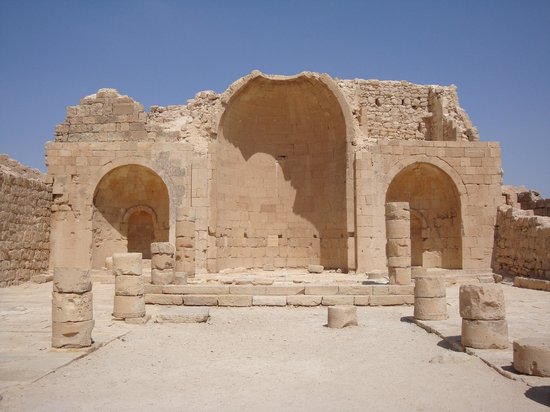
Figure 1: View of the northern church in Shivta (Photo: https://upload.wikimedia.org/wikipedia/commons/0/06/PikiWiki_Israel_13700_Northern_church_in_Shivta.jpg)
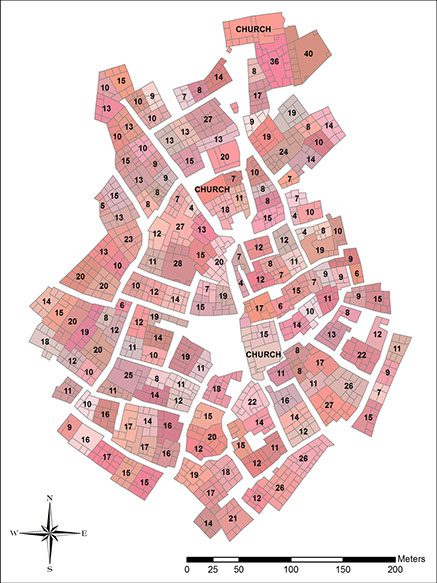
Figure 2: Map of Shivta. Indicated are the number of inhabitants per dwelling house (Map by Giacomo Fontana)
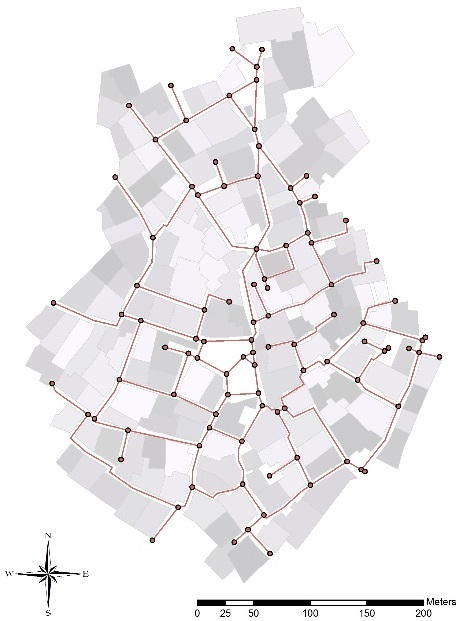
Figure 3: Map of the roads network at Shivta used for the analysis (Analysis and Map by Giacomo Fontana).

Figure 4: Map of the results of the ‘reach analysis' (Analysis and Map by Giacomo Fontana)
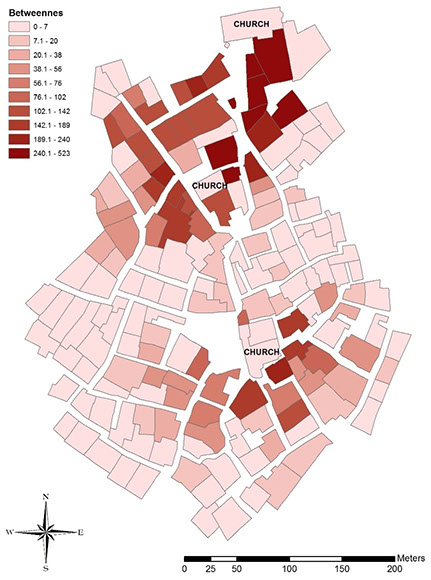
Figure 5: Map of the results of the ‘betweenness analysis' (Analysis and Map by Giacomo Fontana)